
Sensors: who passes your window, in numbers
A small sensor at the screen counts people and vehicles in front of the shop window, with direction and time. It counts, it recognises no one, and it stores no images.
Where the sensor sits
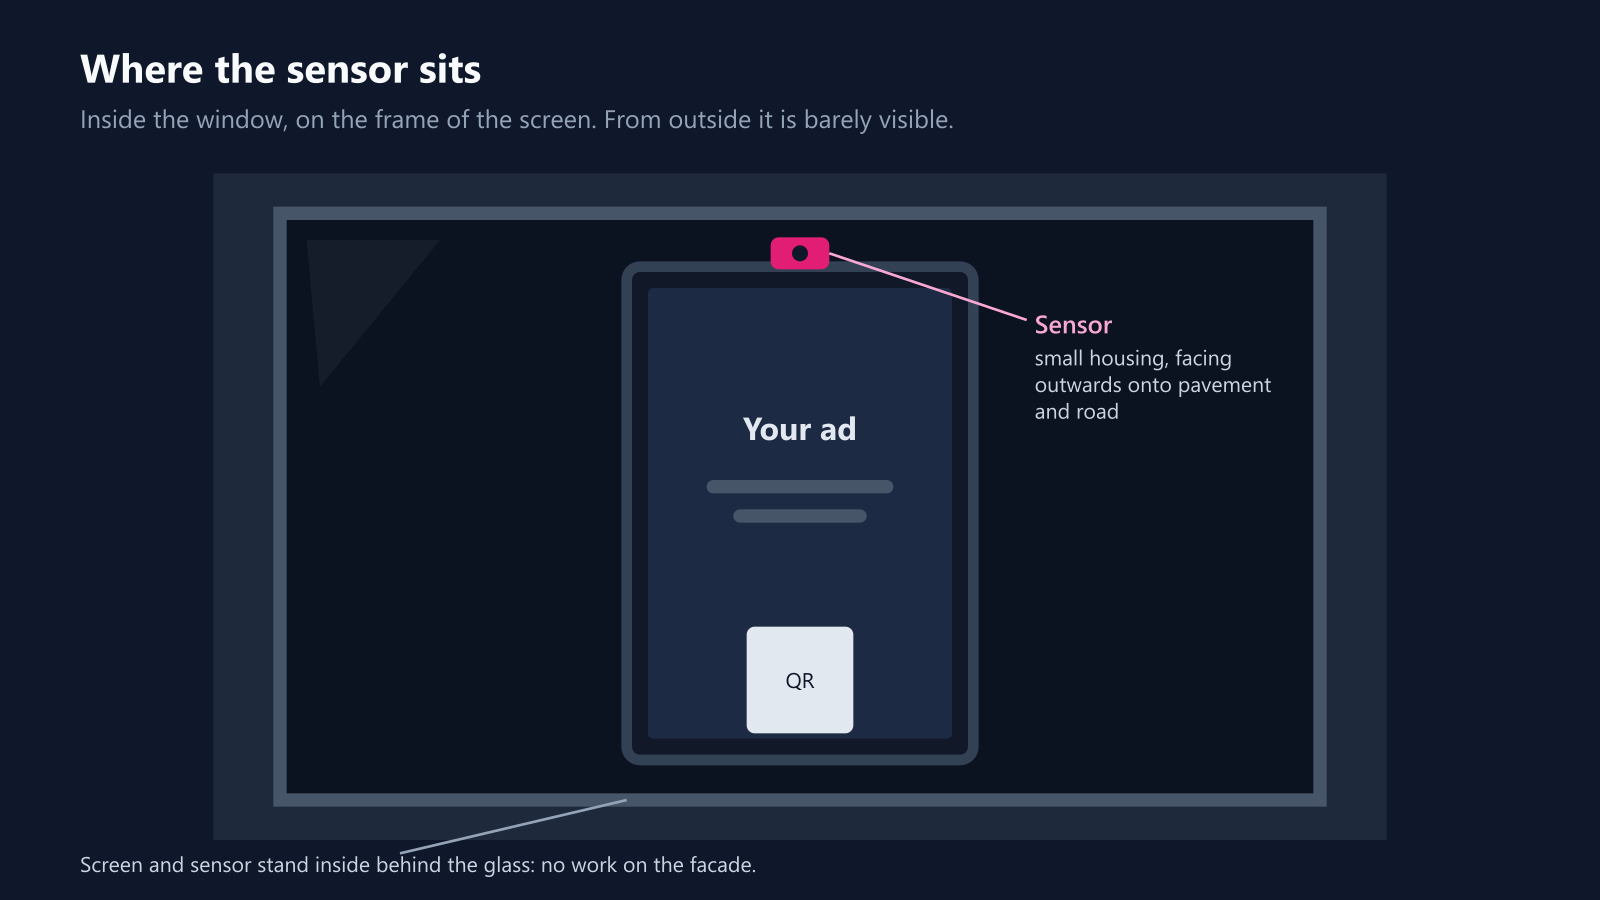
The sensor sits inside the window, on the frame of the screen, and looks through the glass onto pavement and road. Nothing is drilled, glued or wired on the facade. From outside it is barely noticeable: a small housing that belongs to the screen.
How it counts
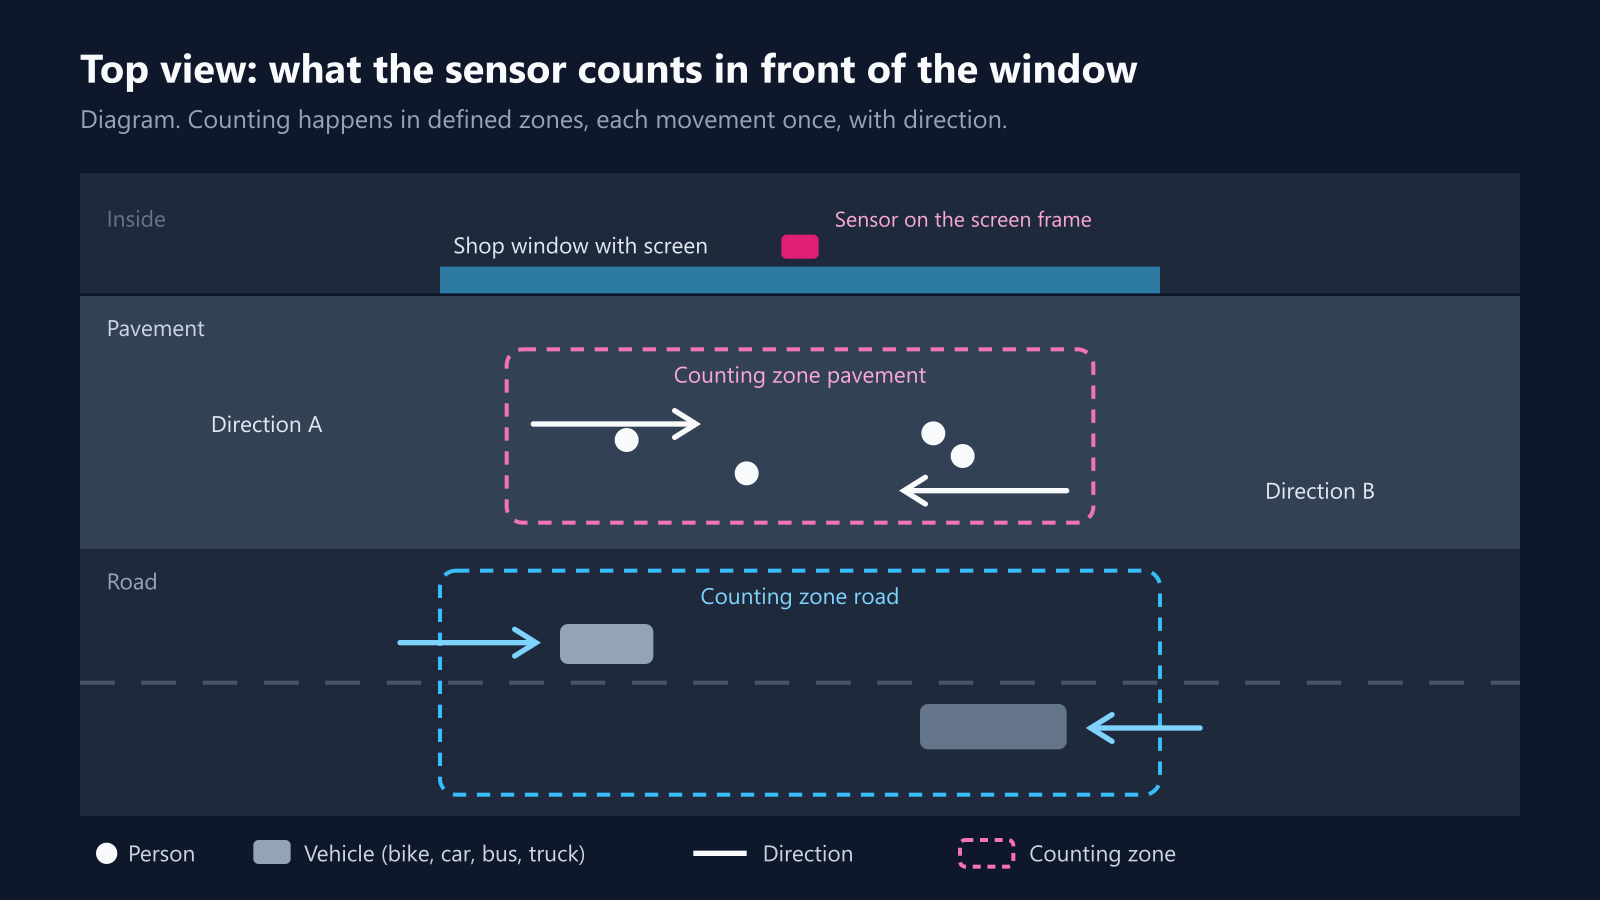
During installation we define which areas in front of the window are counted, for example the pavement and the road. Whatever walks or drives through such an area is counted once, together with its direction. The sensor tells apart people, bicycles, cars, buses and trucks.
Counting runs continuously. What reaches your schaupunkt account is a summary per hour: how many, which direction, which kind. Every analysis further down is built from these hourly values.
Privacy belongs here, not in the small print
No face recognition, no identification, no images in the counting program. Detection runs on the sensor itself; only numbers are passed on.
There is one exception, during installation: the alignment aid. It is switched off by default. When switched on, it uploads a still image with defined private areas blacked out, so that someone can check the sensor points the right way. More in our privacy policy.
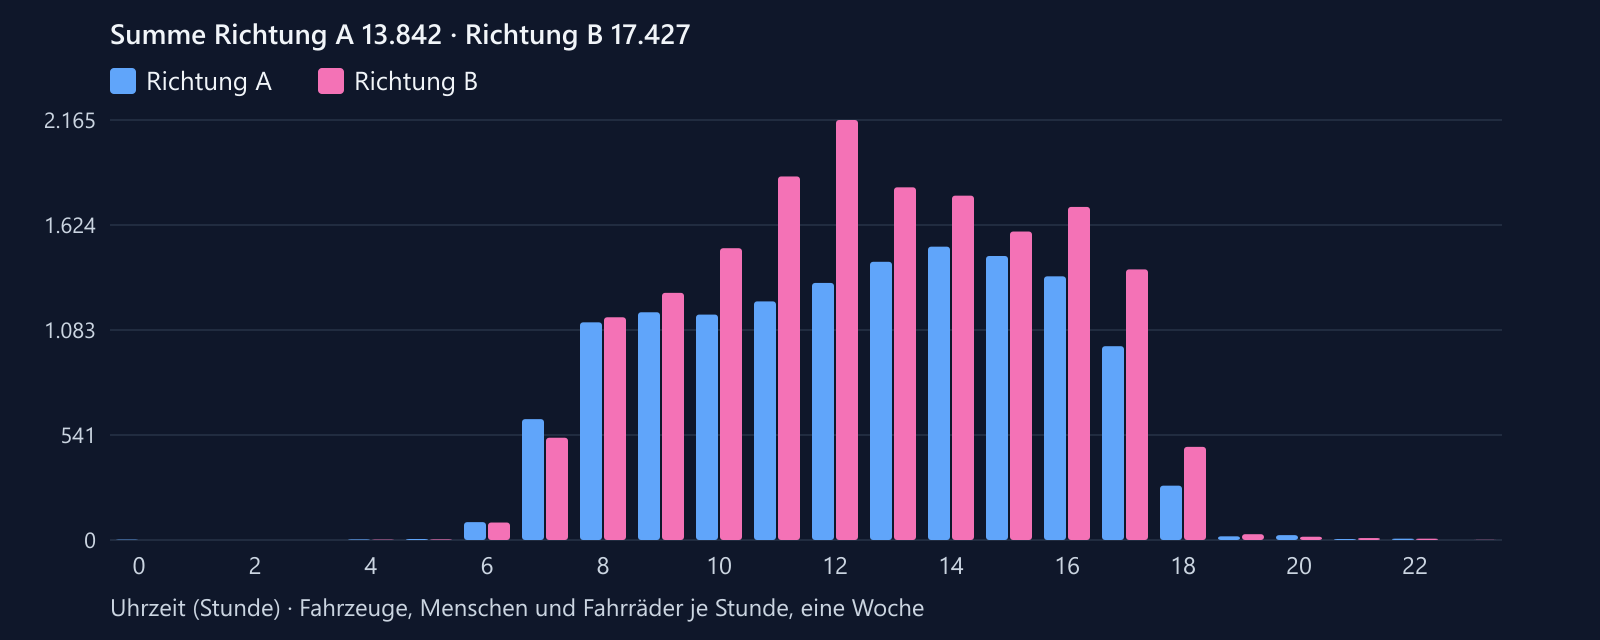
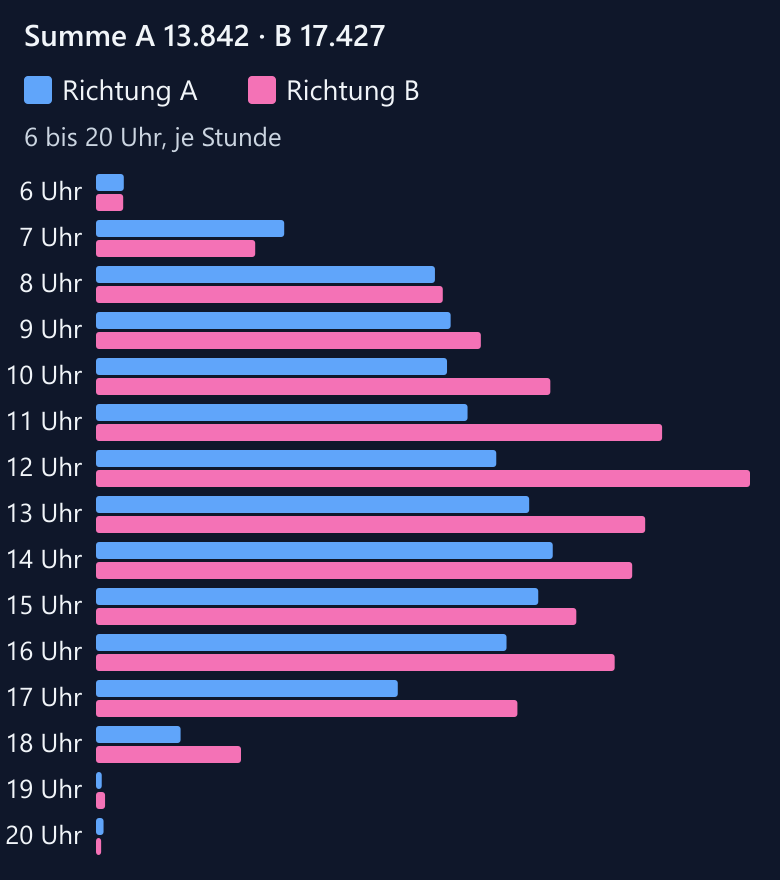
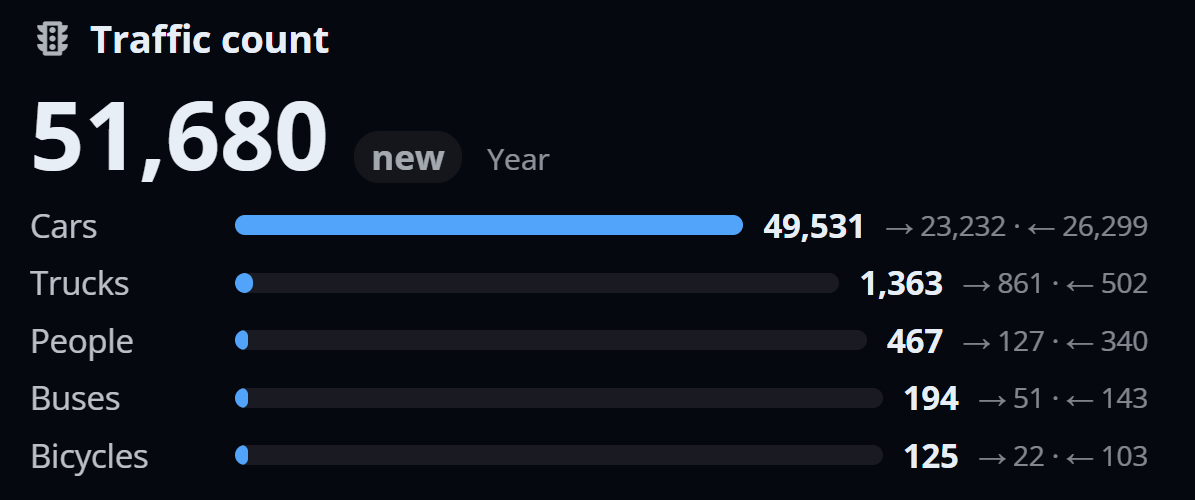
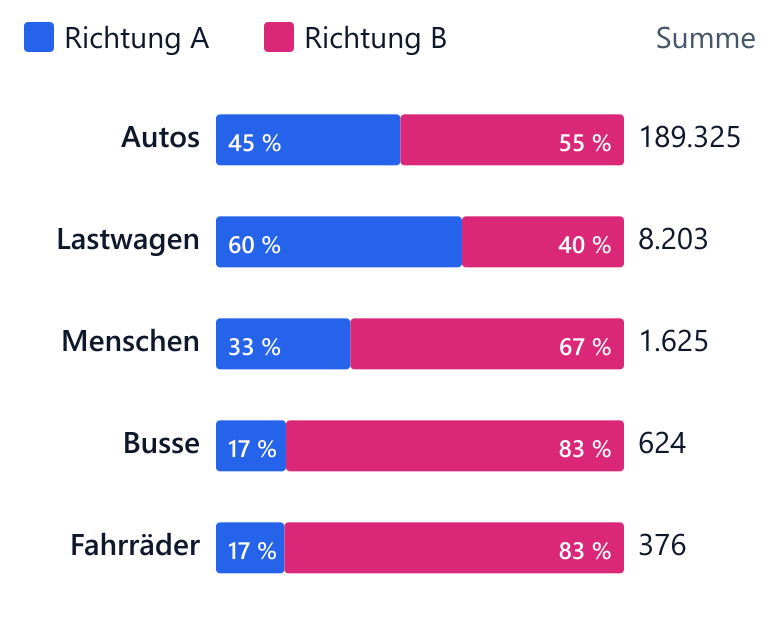
Location analysis as a ready-made presentation
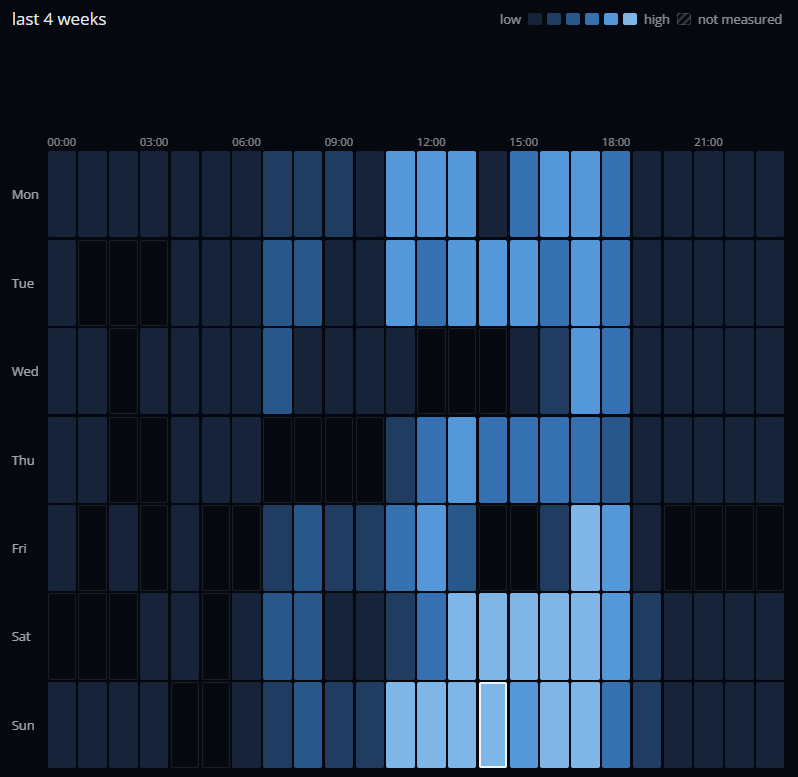
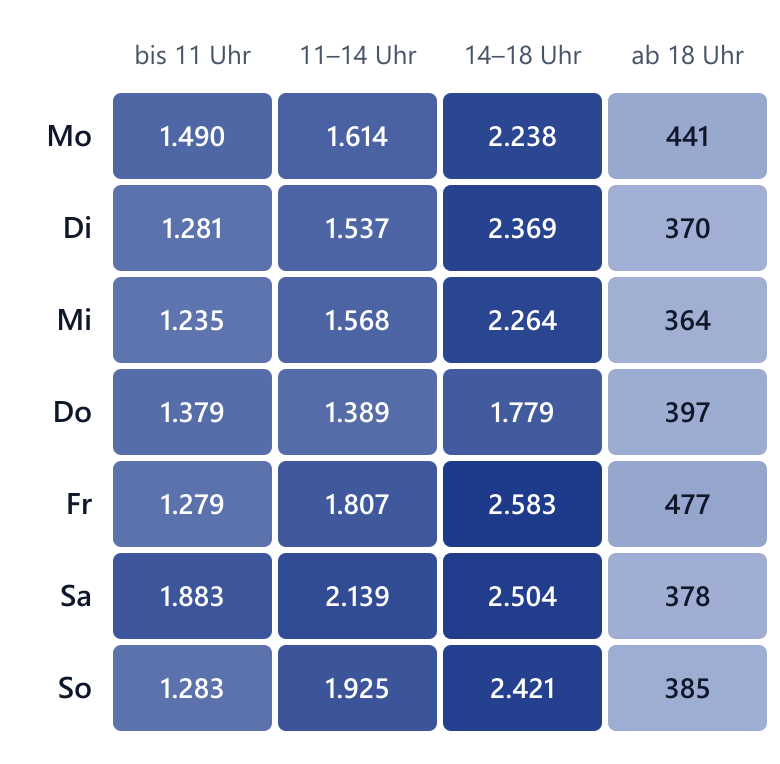
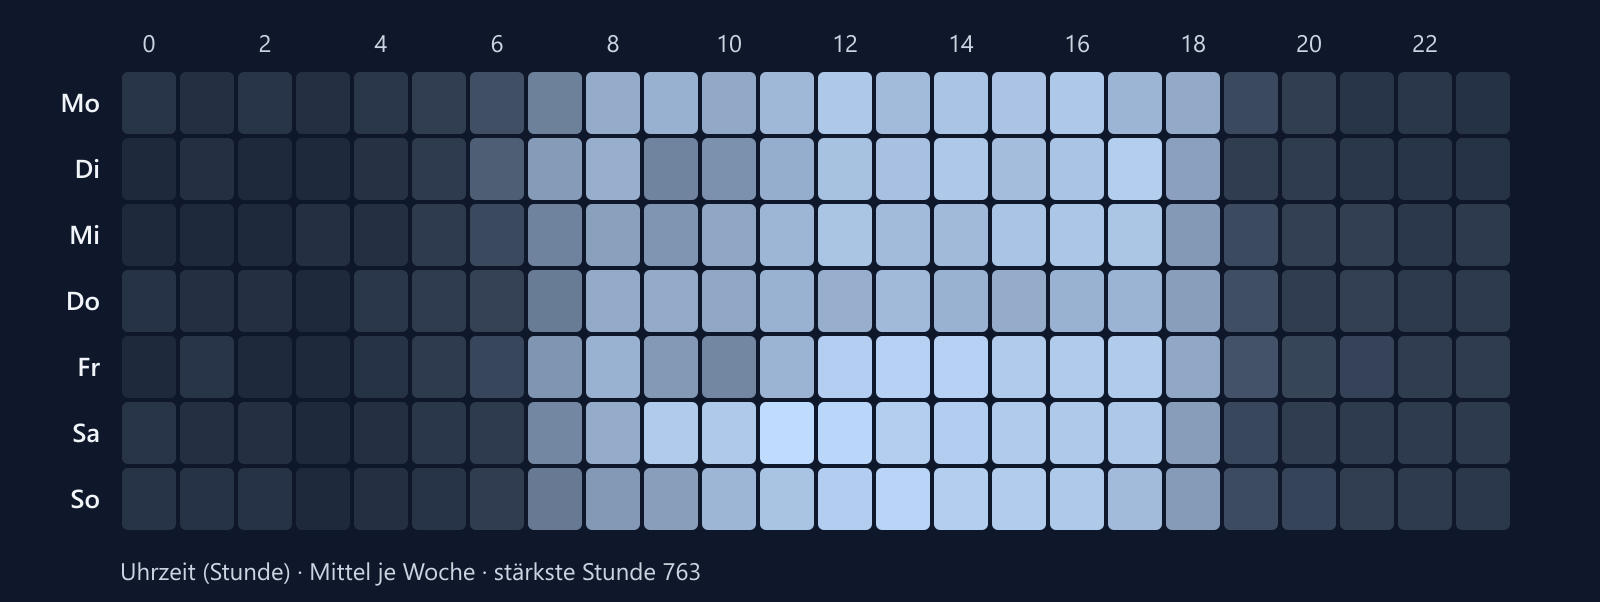
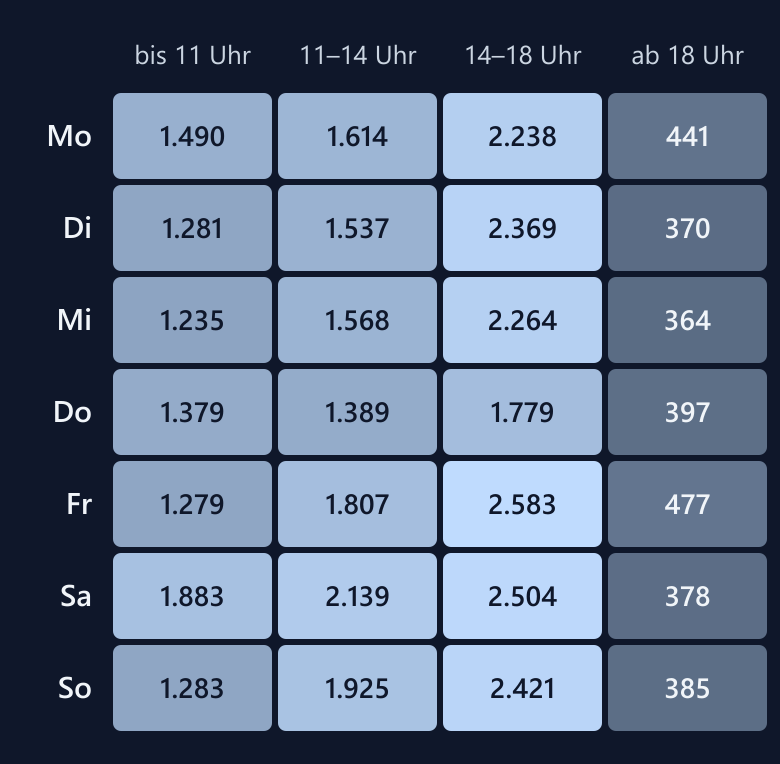
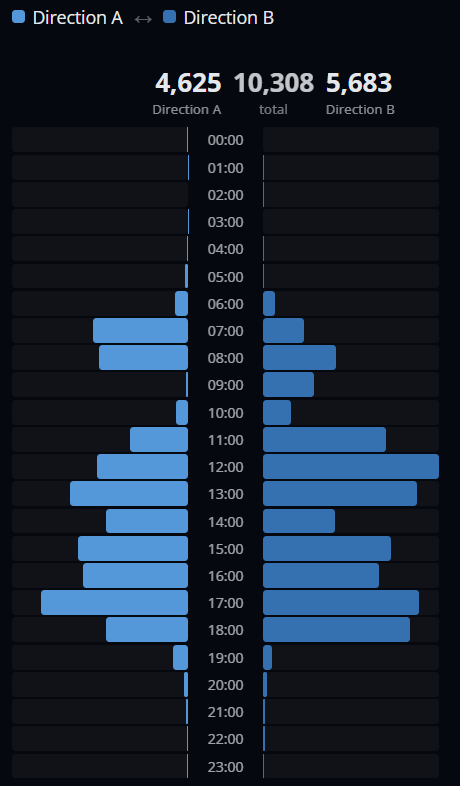
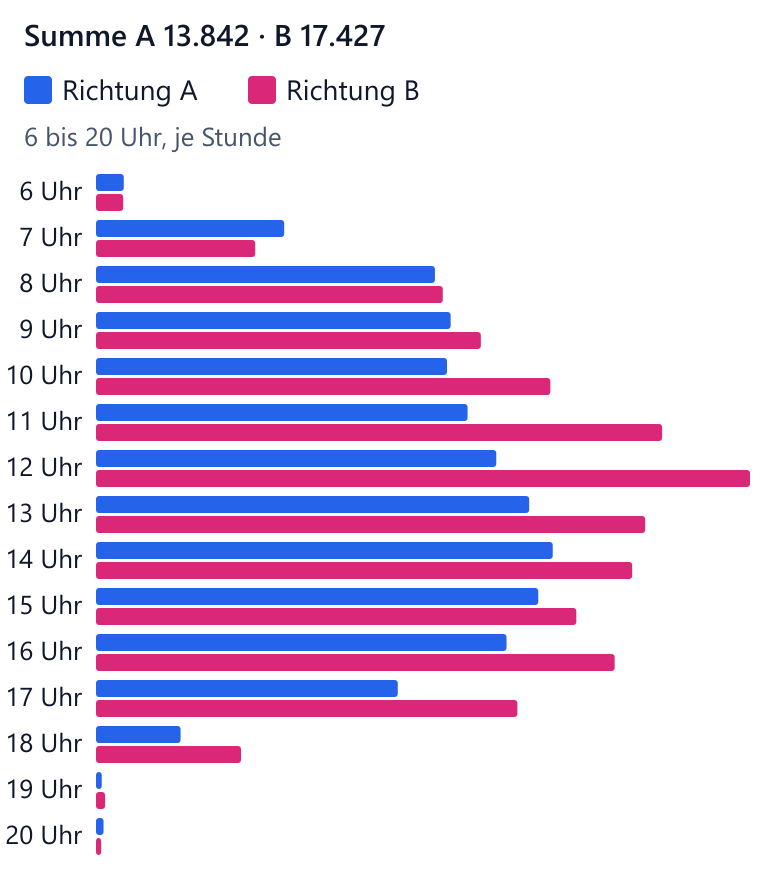
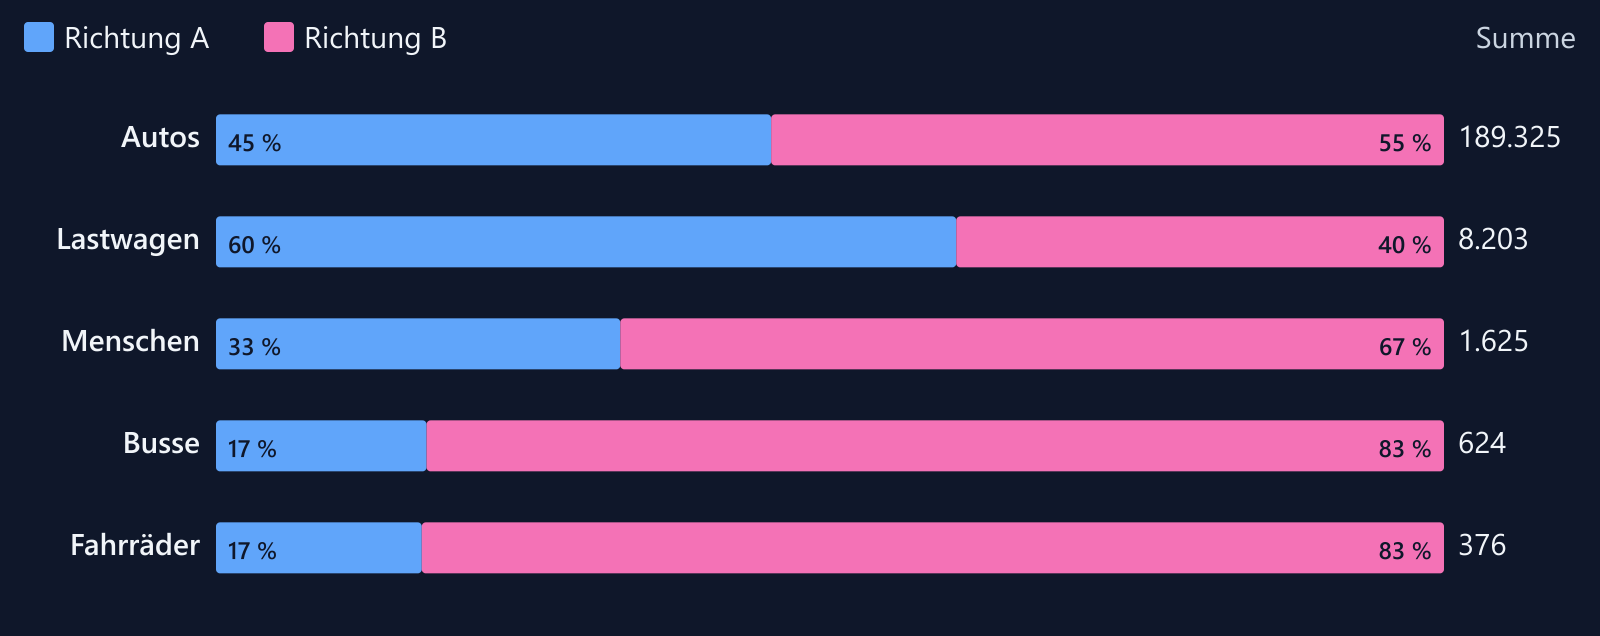
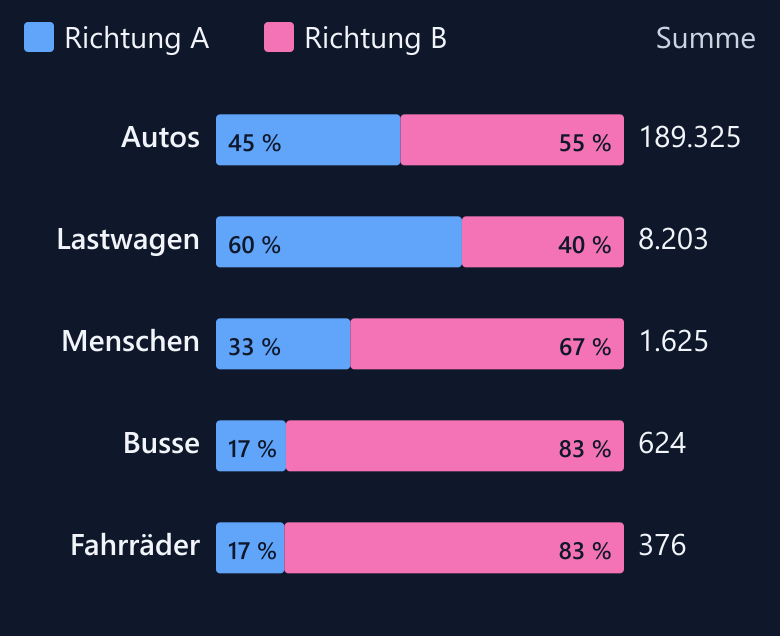
The counts become a presentation for each location: people, bicycles, cars, buses and lorries with direction and time, the weekly grid, the peak hours and the advertising contacts per hour. It helps you win over advertisers from the neighbourhood and place ads exactly in the busy hours.
Frequently asked questions about the sensor
The sensor recognises no one and stores no images; only numbers per hour reach your schaupunkt account. No personal data is created. The only exception is the alignment aid, switched off by default, with private areas blacked out. We agree a notice at the window with you during installation.
The sensor counts every pass individually, with direction and kind. You see the values actually counted per hour, without extrapolation.
The sensor stands inside behind the glass; rain and cold do not reach it. During installation we align it for a clear view of pavement and road. Weather itself is recorded separately and compared with traffic.
Yes. The sensor is a device of its own and is added to an existing schaupunkt screen. The screen also runs without a sensor.
Next
- Advertise: reach the busy hours.
- Host a screen: register your window as a location.
- Prices and Earn with your window: what a location costs and brings.
- Technology: screen and accessories.
- Privacy.
Request a demo
We show you screen, counting and analysis in a personal appointment and answer your questions about your window.
Request a demoRequest a demo
Would the sensor suit your window?
Register your location and we’ll tell you what’s possible there.
Register a location